

**This case study narrates my journey and experience and all sensitive information has been either altered or omitted. It is purely self-directed and representative in nature.
Backgroud
The project began with an open ended brief given by the client which was a analytics company. They were looking to transform the way their customers i.e medium to large enterprises were doing retail analytics in a way that could help them devise profitable marketing strategies.
Project Brief
To design a desktop web app and native mobile app for a self-service retail analytics tool.
WHY A MOBILE APPROACH?
Since the potential target audience mainly consisted of business professionals on the move, we had to consider developing a mobile solution for the same as it gave us many advantages :
✅ Reduced time to the information
✅ Reduced Time To Decision
✅ Improved Decision Making
✅ Improved performance
✅ Increased revenue
✅ Competitive advantage
COMPETITOR BENCHMARKING AND ANALYSIS
Following extensive secondary research, I analyzed existing market solutions, beginning with a benchmark analysis of key features. This clarified direct competitors in my domain. I then examined top industry products in detail, evaluating their offerings, design, and user experience to discern effective elements and potential pitfalls.
Users and Audience
PRIMARY RESEARCH
Post secondary research, I validated my findings with stakeholders and product managers to ensure alignment with their expectations. The product manager interview clarified the current workflow and main modules, which I mapped out to inform my information architecture later.
Few insights from their interviews -
STAKEHOLDER INTERVIEW
The marketing goal is both sales and market penetration along with delivering a great user experience. Success for the product would mean adoption.
PRODUCT GOAL
PROBLEM
The biggest problem the industry is facing is how do you translate the data which they have accumulated over time and make it very relevant for them in order to drive business decisions.
FEATURES
-
SaaS tool used by the marketing team to create targeted campaigns.
-
A scalable solution where a customer can access their data on different devices like tablets, laptops or the desktops. As well as a crystallised view for them to quickly access data in regards to the business on their smartphone.
-
An automated system through the power of machine learning and artificial intelligence for better decisions.
-
Cater to all channels like social media, email and web and make it very adaptable.
CUSTOMER SEGMENT
Customer segment is e-commerce or commerce companies, so its very important that the campaigns that they launch are targeted to the right audience.
PRODUCT MANAGER INTERVIEW
ONE STOP SOLUTION FOR MARKETERS
-
Building profile databases
-
Making rules engines
-
Customer segmentation
-
Selecting prospective customers
-
Launching campaigns.
The campaigns will be launched with the help of integrated tools and there will be an additional feature of creative development as well to streamline the process and enable the users to become self sufficient.
The results of the campaigns will we be tracked in real time and will also provide actionable insights and predictive analysis. The users will be able to generate reports and also share them

These interviews helped me in narrowing the target audience to Commerce and E-commerce Retail Enterprises.
Next, I analyzed a user interview conducted by my team and noted down the most relevant and helpful data in the form of insights.
All of this research combined aided me in building the problem statement and scope of the project.
USER INTERVIEW
An automated and reliable platform like a software would reduce the miscommunication almost close to none.
She would prefer a better way to present the complex reports using charts and other visualisation tools
The tool should be user friendly and intuitive. Technical jargon should be avoided.
Instant one click shares where the user can share live links, would make the entire process much easier.
The tool should be completely automated which can validate and consolidate all the data is necessary.
Machine learning algorithms using an easy to use search would be helpful.
Problem Statement and Scope
Marketers have a lot of data collected but they do not know how to make sense of it. They are not able to seamlessly conduct data analytics as it is a very time-consuming and complicated process. They need a self-service solution that is extremely easy to use.
AIM
The aim of the product is to design a one stop solution for marketers from medium to large enterprises, that will enable them to conduct the retail data analytics process by themselves and with ease.
PROJECT OBJECTIVES
To design a web application for desktop and a native mobile app for android which will let the users be constantly updated and ready to take actions based on the insights provided.
BENEFITS
The successful implementation of this app will ensure the following benefits:
-
Faster Customer Database Building
-
Quick and Easy Customer Segmentation and Targeting
-
Instant Campaign Launching with In-built Creative Builder
-
Campaign Management and Real-Time Tracking
-
AI-Powered Search and Recommendation
-
Custom Report Generation and Visualisation tools
-
Automatic Actionable Insights
-
One-click Sharing and Downloading of Reports
-
Controlled Multiple Role-Based Access in application
Process
PERSONAS, SCENARIOS AND USER JOURNEY
Based on the findings, initially, I had developed two broad personas - a data analyst and a marketing executive, who would be future users of the solution. However, since the MVP scope only focused on the latter, I decided to use his persona for further research and brainstorming.

IDEATION & BRAINSTORMING
The detailed user journey map proved to be really handy when I actually started brainstorming about the solution and its features in the form of a simple mind map. This map was later detailed out till I had an extensive overview of the product.
Since we were working on an MVP, the scope was limited to two of the major modules - Segmentation and Campaign Management.

TASK FLOWS AND INFORMATION ARCHITECTURE
Next, I started building elaborate user task flows by highlighting all the entry/exit points, the actionable items, and the read-only data and features. I used all these flows to in turn map out the entire comprehensive information architecture of the product.


Prototyping
With a clear architecture defined, I could move forward with the prototyping stage. I started by designing the navigation structure including the main modules, global actions, and navigation cues.
MAIN NAVIGATION
-
Vertical Nav Bar
-
Modal Drawer
-
Opens on Hover
NAVIGATION CUES
-
Breadcrumbs
-
Highlighted section

GLOBAL NAVIGATION
-
Search
-
Help
-
Notifications
CTA BUTTONS
-
Primary
-
Secondary
SKETCHES
Next, I started with rapid prototyping in the form of sketches. After numerous iterations of layouts and screen flows, the best approach was finalized. This was then converted to wireframes.


WIREFRAMES


REVIEW WITH STAKEHOLDER
After the completion of the detailed wireframe, we had a review session with the main stakeholder. He had one very interesting feedback which led to the development of a new value-added feature - ‘ A smart AI-powered assistant’ He wanted it to make the tasks of the user much easier by guiding them and giving them beneficial actionable insights.
Since this was a fairly new topic, I researched some more about how it works.
-
Artificial intelligence in business intelligence helps democratize data and improve analytics adoption.
-
If implemented properly, AI pulls actionable insights from complex data sets and automatically recommends the next actions.
-
AI provides data points exactly where and when they are needed most with very little work required by the user.
-
By using AI, you’ll be able to harness the power of the data you collect, identify more trends, build recommended actions based on those trends, and ensure that those actions and surrounding context are delivered to your end-users exactly when and where they need them.
Based on the gained knowledge, I added an assistant in the form of an icon which will be visible throughout the application. Clicking on it would open a right panel containing suggestions or insights for the user.
-
Migo is an AI-powered buddy which helps provide actionable insights and also helps the user complete the task faster by providing suggestions.
-
Migo can be accessed at all times from a right-hand side panel
-
In a scenario where the user is new to the tool, or feeling lost, migo can guide the user


DEVELOPING A MOBILE VERSION
After the entire wireframing stage of the web app was complete, I subsequently started working on converting those into mobile wireframes. For this, I had to first decide what all features I needed to omit in the mobile version.
For the actual components and design of the app, I used the Google material design system as a handbook.


Outcome
USER INTERFACE
The final stage of the project was designing the user interface. I started visualizing the look and feel based on the created mood board. I further detailed it out into a style guide consisting of colors, typography, illustration styles, and UI components.
Using this guide I converted all the wireframes into high fidelity visual designs.
STYLE GUIDE & UI COMPONENTS
COLORS


TYPOGRAPHY
UI COMPONENTS

Final Solution
Login and Dashboard
The dashboard is the landing page of the web app. It will consist of all the pinned reports to provide instant access


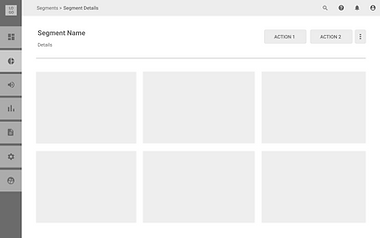
Segments
The segments module allows users to create segments based on various parameters, use those segments in campaigns and also helps in analysing them based on key performance indicators.
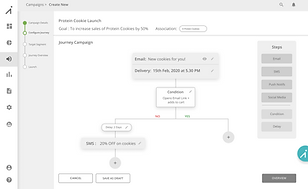
Campaigns
Under campaigns module, the users can easily create campaigns for different target segments and products using the journey creator form. They can also view the listing and analysing the campaign performance with the added help of the AI assistant


Mobile App


REFERENCES
-
https://trackmaven.com/blog/retail-marketing-analytics-prove-sales
-
https://www.icontroldata.net/blog/5-benefits-of-retail-analytics-in-2018
-
https://www.martechadvisor.com/articles/customer-experience-2/what-is-customer-experience-strategy-best- practices-trends/?zd_source=mta&zd_campaign=14487&zd_term=lipikhandelwal
-
https://www.gooddata.com/blog/artificial-intelligence-future-business-intelligence
-
gartner.com/en/information-technology/glossary/self-service-analytics
-
https://www.digitalvidya.com/blog/history-of-digital-marketing/
-
https://bizfluent.com/info-8179843-chocolate-marketing-ideas.html
-
https://www.toptal.com/project-managers/it/history-of-business-intelligence
-
https://lab.getapp.com/advantages-self-service-business-intelligence/
-
https://www.digitalsignageconnection.com/retail-analytics-future-retail-right
-
https://auth0.com/blog/retail-analytics-past-present-and-future/